Knowledge Graphs: Connecting the Work of Nonprofits to the UN Sustainable Development Goals
The Potential Opportunities For Using Semantic Methodologies To Better Understand Impact And Measurement Make Knowledge Graphs An Interesting Avenue To Explore.
By Jesse Bourns and Brittany Witham
We recently completed a project with the Common Approach exploring how knowledge graphs can be applied to outcome measurement data structured in the Common Impact Data Standard. While this work is still preliminary, the potential opportunities for using semantic technologies to better understand impact and measurement in the social sector make knowledge graphs an interesting avenue to explore. For more about the project, read the full report here.
While the United Nations Sustainable Development Goals (UN SDGs) aim to address issues in human and environmental health and well-being by 2030, there are gaps in structured data about the related activities of many organizations working on these issues.
Since there isn’t any one standard for organizations to follow when producing data about their activities, the challenge of compiling this information as data across thousands of organizations in hundreds of countries is a daunting one. To address these gaps, we need to find approaches for linking activities and indicators in a way that is consistent and standardized yet flexible—as well as adaptable to the different actors and contexts of the many interventions employed by organizations working toward the goals.
In this project, we explored the use of knowledge graphs and the semantic pathways they provide as an approach to understanding the impact of social outcomes. How much does a particular indicator contribute to a given SDG? How do different types of indicators relate and what common pathways do they follow? Made of graphically-structured data, knowledge graphs increase the data’s utility by visualizing semantic pathways, which in turn allows for better analysis. In this way, knowledge graphs could help to uncover linkages, and eventually even provide a way to help with the quantification of the collective impact of all organizations on the SDGs, as well as offer more insight about relationships between different projects, programs, and services.
From a technical perspective, the interconnectedness of the UN SDGs and the varying applications of the work of nonprofits seem like a textbook case for a knowledge graph. For example, increased water scarcity due to climate change has serious implications for food security worldwide. Many organizations are engaging in activities like distributing food, promoting sustainable agriculture, and implementing water-saving practices. However, it is not straightforward, from a data perspective, to quantify or link these contributions to their SDG targets. It isn't enough to assume that indicators are grouped together simply because they appear to relate to a similar long-term impact—we also want to understand the “pathways” of how they are related. A knowledge graph could link seemingly disparate indicators as being part of the same effort, making it easier to relate the various contributions of those organizations to their respective SDG targets.
For this project, we focused on connecting various indicator data in the Common Approach ontology to the SDGs, with the end goal of visualizing the semantic pathway one indicator would take from output to SDG target. To that end, we developed a “hybrid” ontology to combine the Common Impact Data Standard (how organizations measure their impact), the UN SDG vocabulary (how the United Nations quantifies progress toward their goals), and food security concepts gleaned from a brainstorm with 10C exploring links between social outcomes and UN indicators. This customized “domain ontology” created semantic meaning between the two otherwise unconnected frameworks. We were then able to present a visualization of the ontology using the Neo4J tool, helping us and the stakeholders to understand and validate the linkages between the elements.
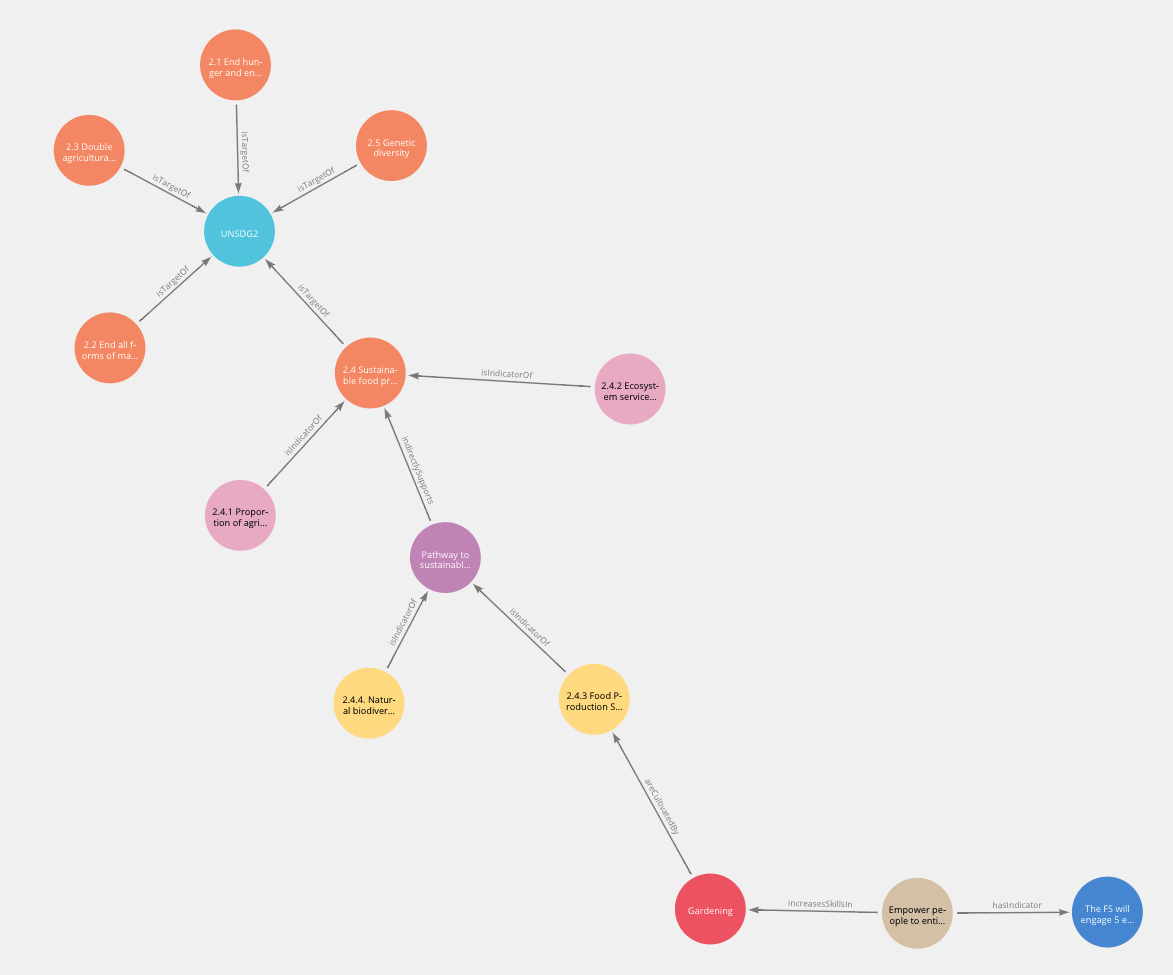
In order to visualize these relationships, we borrowed the concept of “Pathways” developed by the Common Approach and linked outputs to outcomes through these pathways and other relationships we identified between them. As a result, we were able to represent how similar and/or shared outputs and outcomes of projects would fit specific ontologies, and how the associated indicators could be linked to a specific domain. The result is a knowledge graph that maps semantic pathways from the activities of the organizations in the 10C network all the way up to the UN SDGs (Figure 1).
It’s too soon to be certain about whether or how knowledge graphs and the specific approach we experimented with would fully address these challenges, but we’re excited by their potential and the prospect of exploring further. In the future, we hope to refine and apply this approach to the other SDGs, as well as add more kinds of information and applications to this work.
Watch a sample graph walk-through narrated by Brittany Witham and read the full report, Knowledge Graph Opportunities: Applications for the Common Approach to Impact Measurement.
Figure 1. Representation of a knowledge graph using Neo4j Bloom software. Headline indicators connect to initiatives (red), which connect to the social outcome (brown) and the organization’s indicator (blue).


